Analyzing your data is one of the main objectives in RUNALYZE. Therefore we added a new tool to the activity view.
Analyze time series
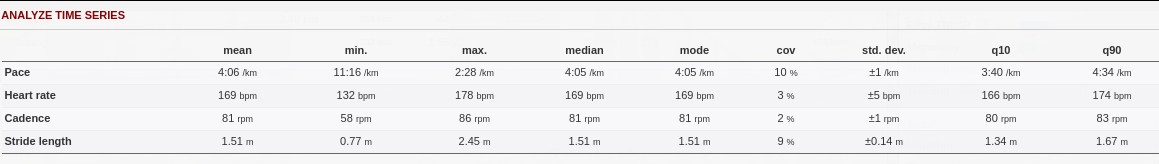
So far, this tool offers some basic statistics for your complete time series, i.e. (arithmetic) mean, minimum, maximum, median (50% quantile), mode (most common value), coefficiant of variance (std / mean), standard deviation and 10% and 90% quantile.
This tool helps to see for example how steady your cadence was. Of course, it’s hard to rely on these values if you did an interval workout as variances will be much larger and your whole activity was not meant to be consistent. In addition, there may be a problem with minimal and maximal values, as these rely on the accuracy of your device.
There are still some ideas of how to improve this tool in the future, e.g. to select a special segment of your activity for this analysis. Feel free to add your own thoughts of what you’d like to see.
Best sub segments
Ever wanted to know what your best sub segments look like? Now it’s possible:
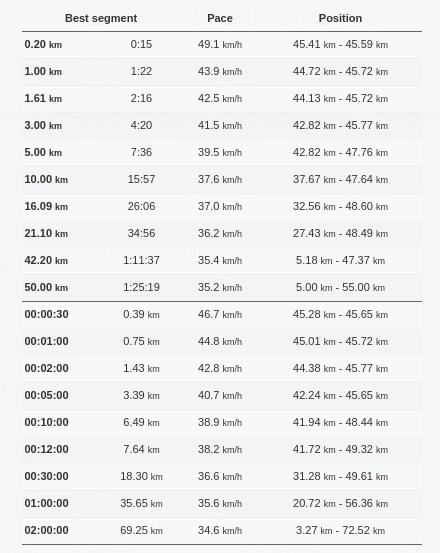
So far, there are some hardcoded distances and times (apart from 100k, all are shown in the above example). We will add a way to adjust these values to your needs later on.
We always have a lot of ideas and try to listen to your feedback to improve RUNALYZE. So please be patient with us. Let us know what your missing