Only recently we added mouseover information to the Climb Score diagrams and the next improvement follows: The gradient histogram, which was actually planned from the beginning but was not implemented for time reasons so far.
Now it’s finally here: Below the map view a histogram with the distribution of the gradient percentages is shown. Also included is the speed curve depending on the gradient (as long as at least 100 meters have been completed on the gradient). Here you can see at a glance how much the speed suffered from the ascents.
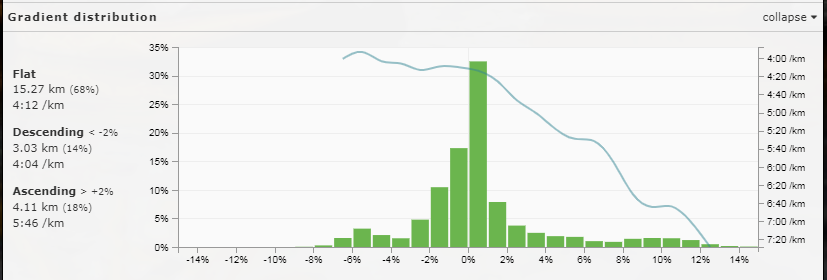
To the left of the diagram the separation into “Flat” (max. 2% ascent/descent), “Descending” and “Ascending” is additionally shown. It should be noted that the segmentation here is somewhat different from that for the “percentage hilly”, which is already assigned to each activity. This can lead to slight discrepancies between the percentages for “flat”.
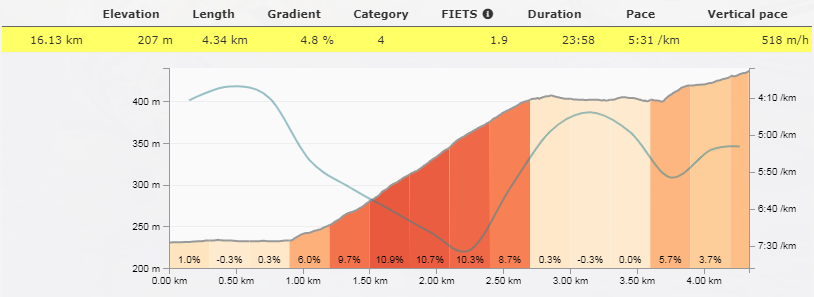
The pace curve was also added in the respective gradient profile of a single ascent. This makes it possible to see whether an ascent was run/driven more or less evenly, or whether there was a significant drop at any point.