The major changes we’ve done for version 3.2 happened in the core system and you will not recognize them directly.
New: ANOVA tool
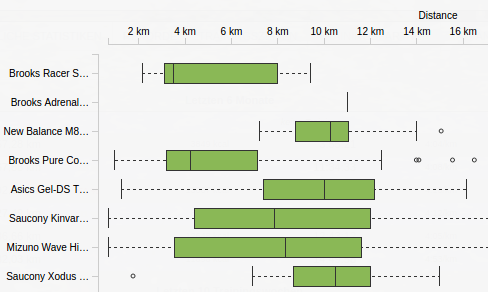
Values are visualized with so-called ‘box plots’. They give an impression of how values of a group are distributed. The middle 50% of all values are within the box itself and the so-called whiskers have a length of at most 1.5-times the interquartile range (i.e. the box’s width). Data points outside this range are called outliers.
This way of presentation allows to compare not only average values (e.g. pace over months) but deviations and outliers between different groupings. For a detailed explanation of box plots, see Wikipedia
New: Panel Plugin – Tags summary chart
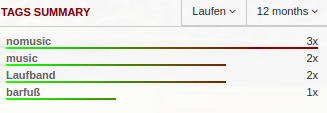
With the tags chart panel you can determine which tags occurs often and which less.
This plugin was contributed by Felix Gertz
Others
- more checks to avoid crashes in activity view
- more efficient storage of gps data (results in smaller backups)
- New url for your shared activity list -> /athlete/
– The old are redirected automatically