Runalyze has a new experimental feature: for activities with HRV data (or RR intervals) the aerobic threshold can be estimated (or at least it’s tried to do so).
The idea for this comes from two recent publications by Gronwald [1] and Rogers [2] and a python workbook by Marco Altini. For this, the activity is divided into sections of a certain length (currently: 3 minutes) and the so-called DFA-alpha1 value is determined section by section. In the mentioned publications it was determined that an alpha1 of about 0.75 corresponds to the aerobic threshold. At higher exertion, the value drops to about 0.5.
This makes it possible – in theory – to determine section by section whether one has trained below or above the aerobic threshold. Furthermore, if enough reliable data are available, the exact aerobic threshold (in terms of power/speed/heart rate) can be estimated by a regression line. In the first publication [1], this was successfully done for data from incremental tests as an example. Currently, it is hoped that this estimation is also possible for arbitrary activities.
In theory, this sounds excellent – in practice, however, this has not been confirmed in our tests so far. Nevertheless, we would like to make this experimental feature available to you in order to collect more experience with it together. The currently chosen scalar parameters as well as the procedure for the regression and possible prerequisites that the data or the structure of the training must fulfill are not set in stone.
Example: Progression run
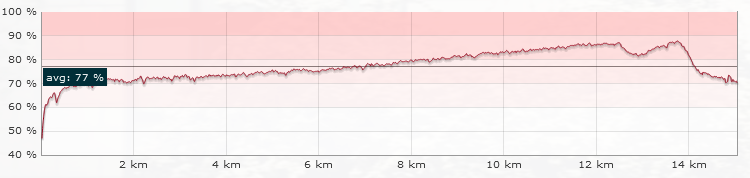
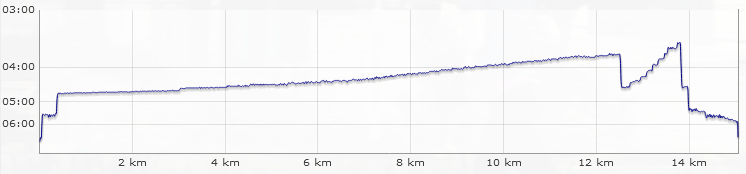
Let’s just look at an example. This is about an hour-long activity on the treadmill, most of which involves a progression run from 4:45/km to 3:45/km (or 68-87%HRmax).
Now when we open the Aerobic Threshold Estimation for this activity, by default only the results section is open. However, we also take a look at the other sections here.
Settings
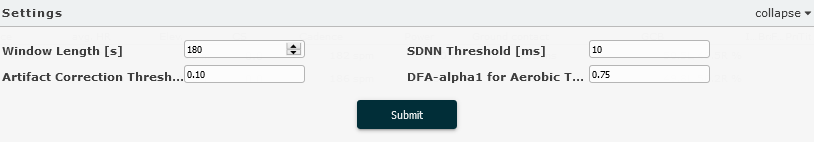
These settings can be changed by experts or for testing purposes. Especially Window Length and SDNN Threshold can have a big influence on the results.
- Window Length: Length of the sections in seconds. By default, the activity is divided into sections of 3 minutes each.
- SDNN Threshold: Threshold value for SDNN. Sections with larger values are not used for regression.
- Artifact Correction Threshold: Relative threshold to remove artifacts from RR intervals. (default: 10%)
- DFA-alpha1 for Aerobic Threshold: At which alpha1 is the aerobic threshold assumed and estimated?
Data
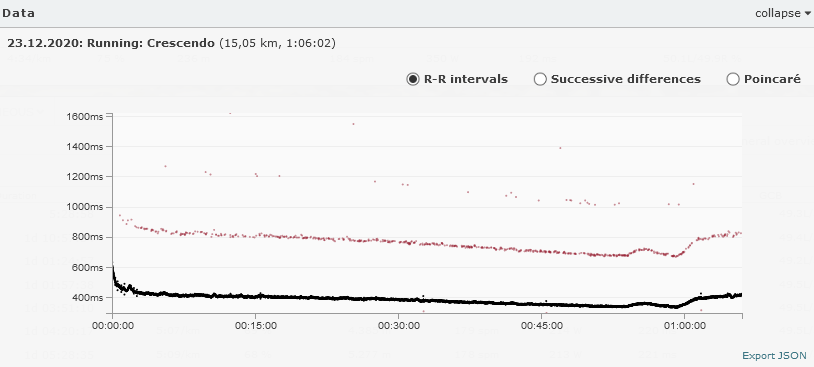
The most important basis for the whole procedure is of course the raw data, i.e. the RR intervals (or beat-to-beat intervals, the intervals between the individual heartbeats). These can be examined graphically here, whereby in the diagram of the RR intervals shown here the values recognized as artifacts are marked in red. The other two graphs show only the acceptable data points. In addition, the data (both RR intervals and time series for velocity, etc.) can be exported in JSON format for further processing with custom tools.
Results
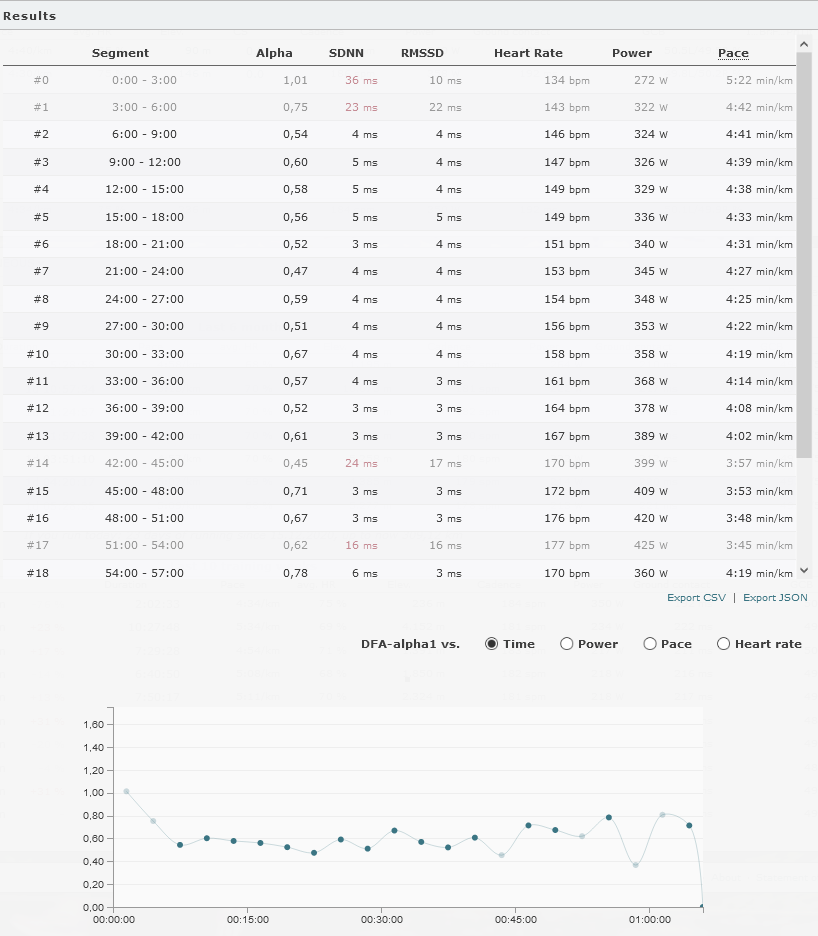
The results are then presented. For each section, DFA-alpha1, SDNN, RMSSD and the average values for heart rate, power and speed are determined. Sections whose SDNN value is above the permissible limit are directly grayed out. This table can also be exported as a CSV or JSON file for possible further processing.
In the graphical representation, we initially only see the alpha values over time. It is already noticeable here: The values are almost all close to the threshold value of 0.75 or below. We would have hoped that the values would decrease over time with increasing intensity. Possibly the intensity at the beginning of the increase with 4:45/km was already too high, the aerobic threshold thus exceeded (from the athlete’s point of view, however, this is still a comfortable pace).
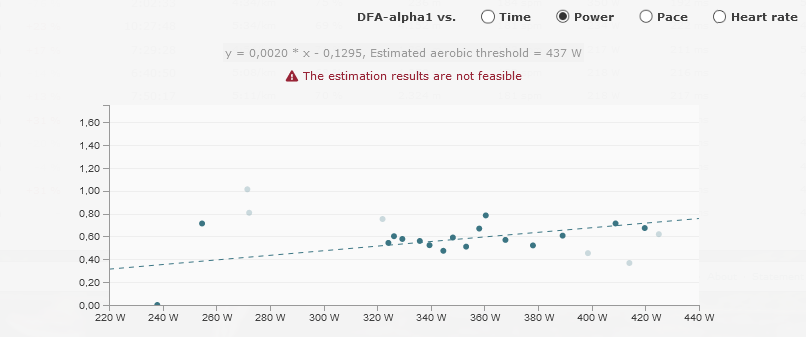
Using the radio buttons, you can switch the view to the regression for power, for example. However, the regression line should decrease and not increase as in this case. Therefore also the warning: These results are not feasible.
Conclusion
We have seen from this example that we do not yet obtain reliable estimates for all activities with the approach we have used so far. Possibly the activities we have tested so far are insufficient, but perhaps the parameters are still unfavorably chosen, the artifact cleaning is not yet good enough, or the regression is not yet optimally adapted to the conditions.
Nevertheless, we would be happy if you already try the tool and possibly have your own suggestions for improvement.
See also
FAQ
I don’t see a HRV recording at my Garmin activities
First: Only chest straps supports HRV recordings and almost all garmin watches do not record them by default. See our help article to activate the hrv recording.
Where do I find this tool?
If your activity has a HRV recording you will find it at the activity view
References
- Gronwald, T., Rogers, B., Hoos, O.: Fractal Correlation Properties of Heart Rate Variability: A New Biomarker for Intensity Distribution in Endurance Exercise and Training Prescription?, Frontiers in Physiology, 11, p. 1152, 2020 doi:10.3389/fphys.2020.550572
- Rogers, B., Giles, D., Draper, N., Hoos, O., Gronwald, T.: A new detection method defining the aerobic threshold for endurance exercise and training prescription based on fractal correlation properties of heart rate variability, Frontiers in Physiology, 2020 doi:10.3389/fphys.2020.596567