About two years ago we introduced our poster tool, which gives you the possibility to visualize your training data. Now, one of the most requested improvements is live: Limit the heatmap to a certain area.
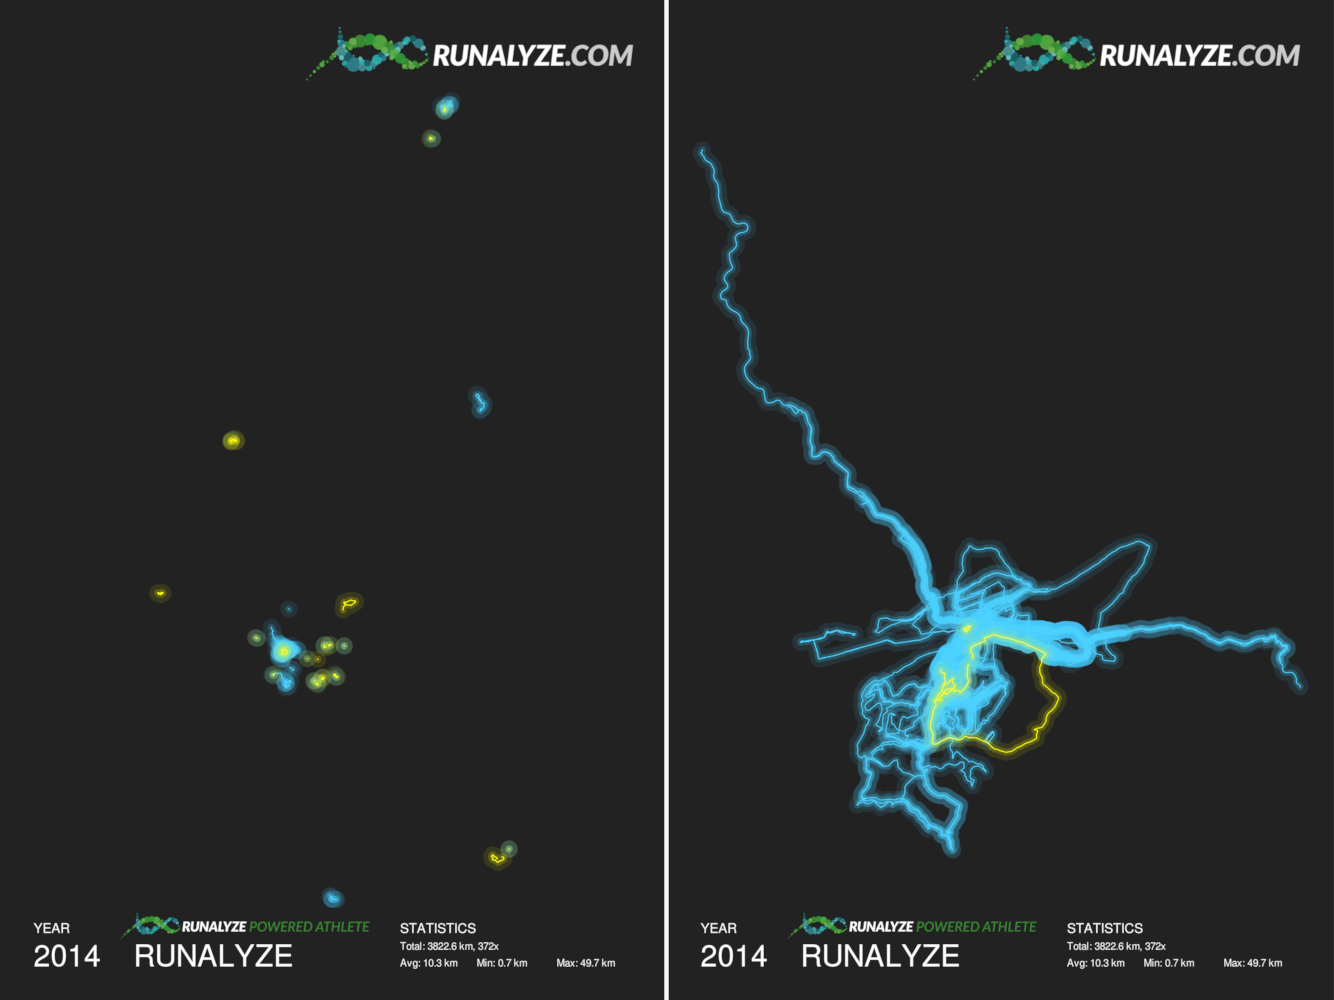
Heatmap for different area selection: everything on the left vs. 10 km radius on the right
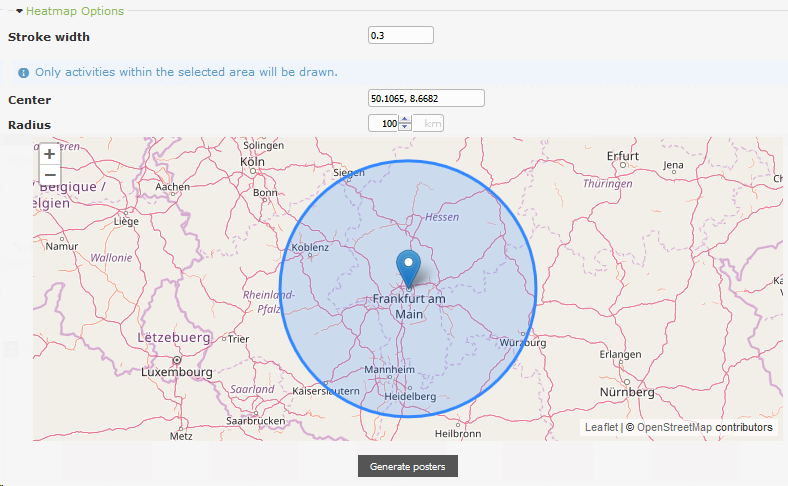
When requesting a heatmap poster, you can set center (as latitude/longitude pair) and radius (in km) for the area RUNALYZE should look at. The center defaults to your last start coordinates and the radius is set to 200 km by default. You can simply drag and drop the marker to choose another location and use the input for radius to adjust the area’s size. All activities starting or ending in the resulting circle will be drawn in the heatmap. The area selection applies for the grid poster as well, the other poster types (circular, calendar) are not affected by these settings.
Furthermore, you can specify the stroke width for the heatmap. It depends on how many activities fall into your selected area and what you prefer. You can choose any stroke width between 0.01 and 1.0 (default: 0.3). The following shows three examples for different stroke widths:
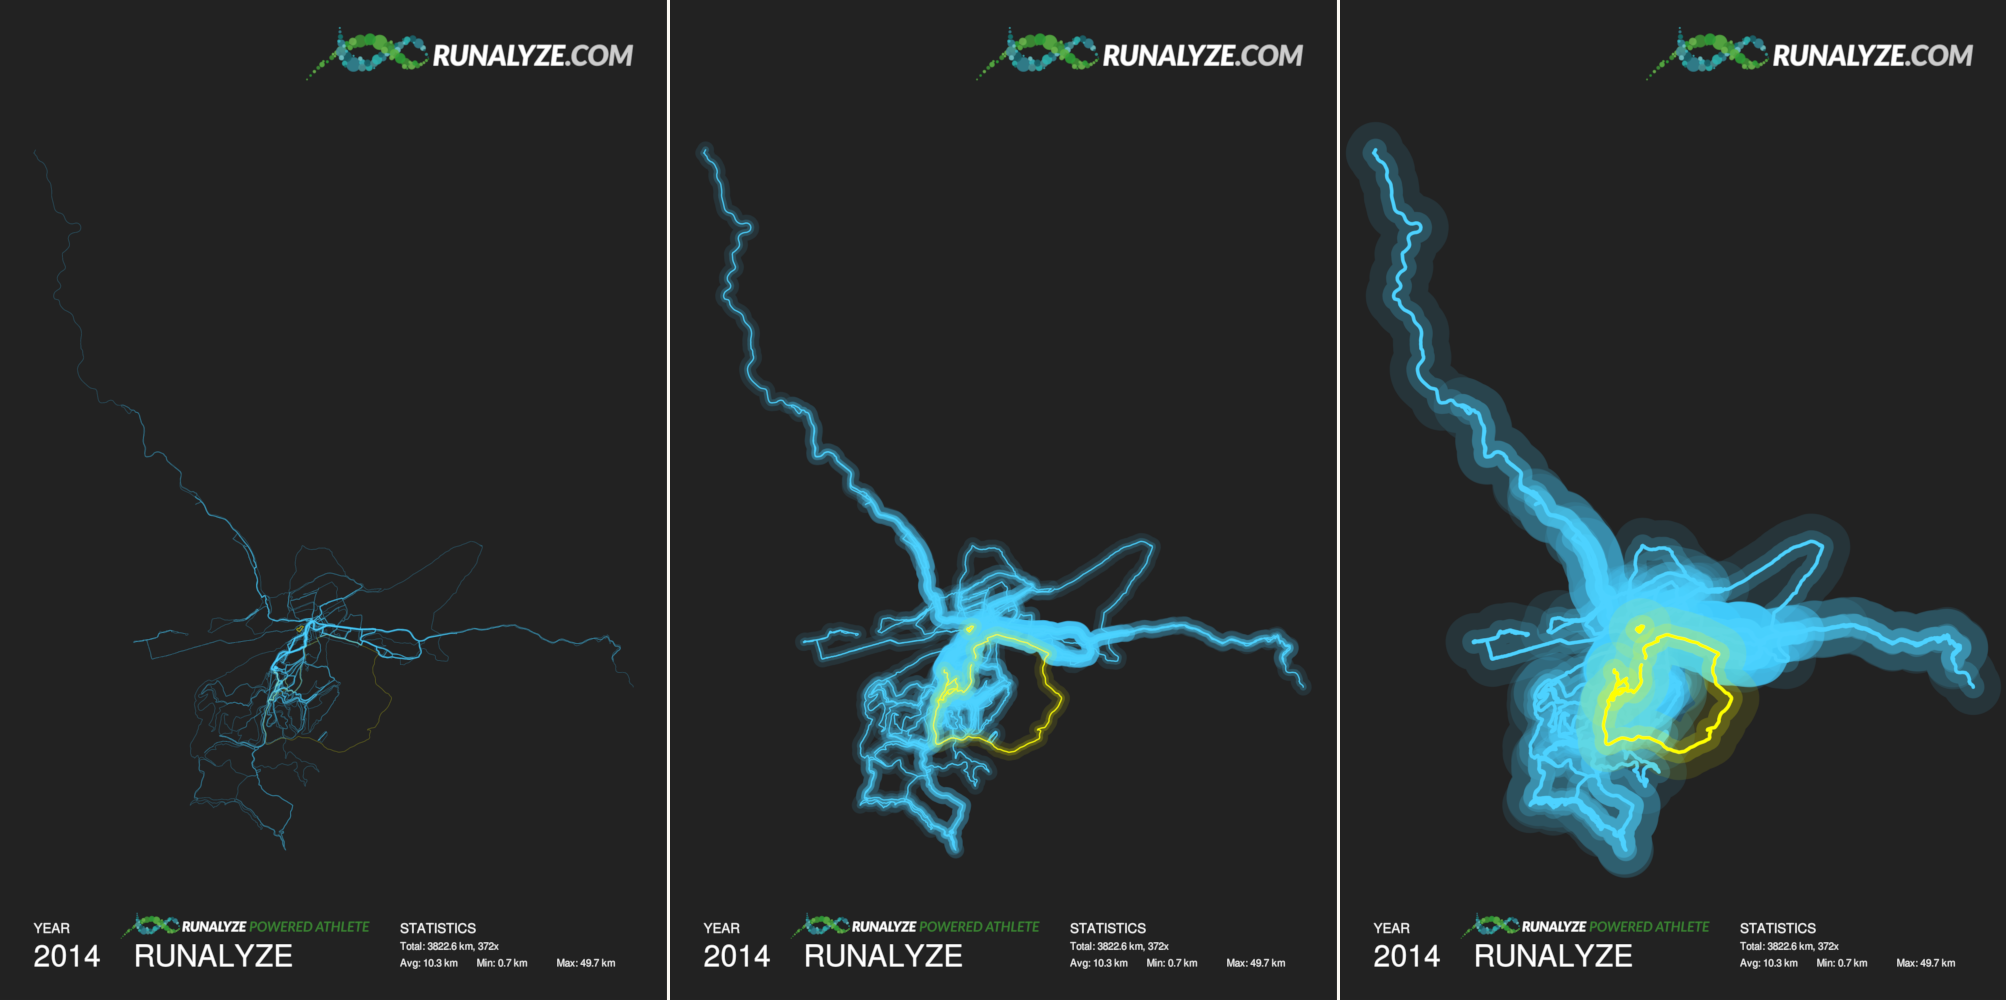
Same heatmap data for various stroke widths: 0.03 / 0.3 / 1.0
In addition, we added some more options for all poster types. The name printed on the poster can be changed (default: your username), the distance unit can be set to imperial, and a gradient coloring (based on the activities’ length) can be used.
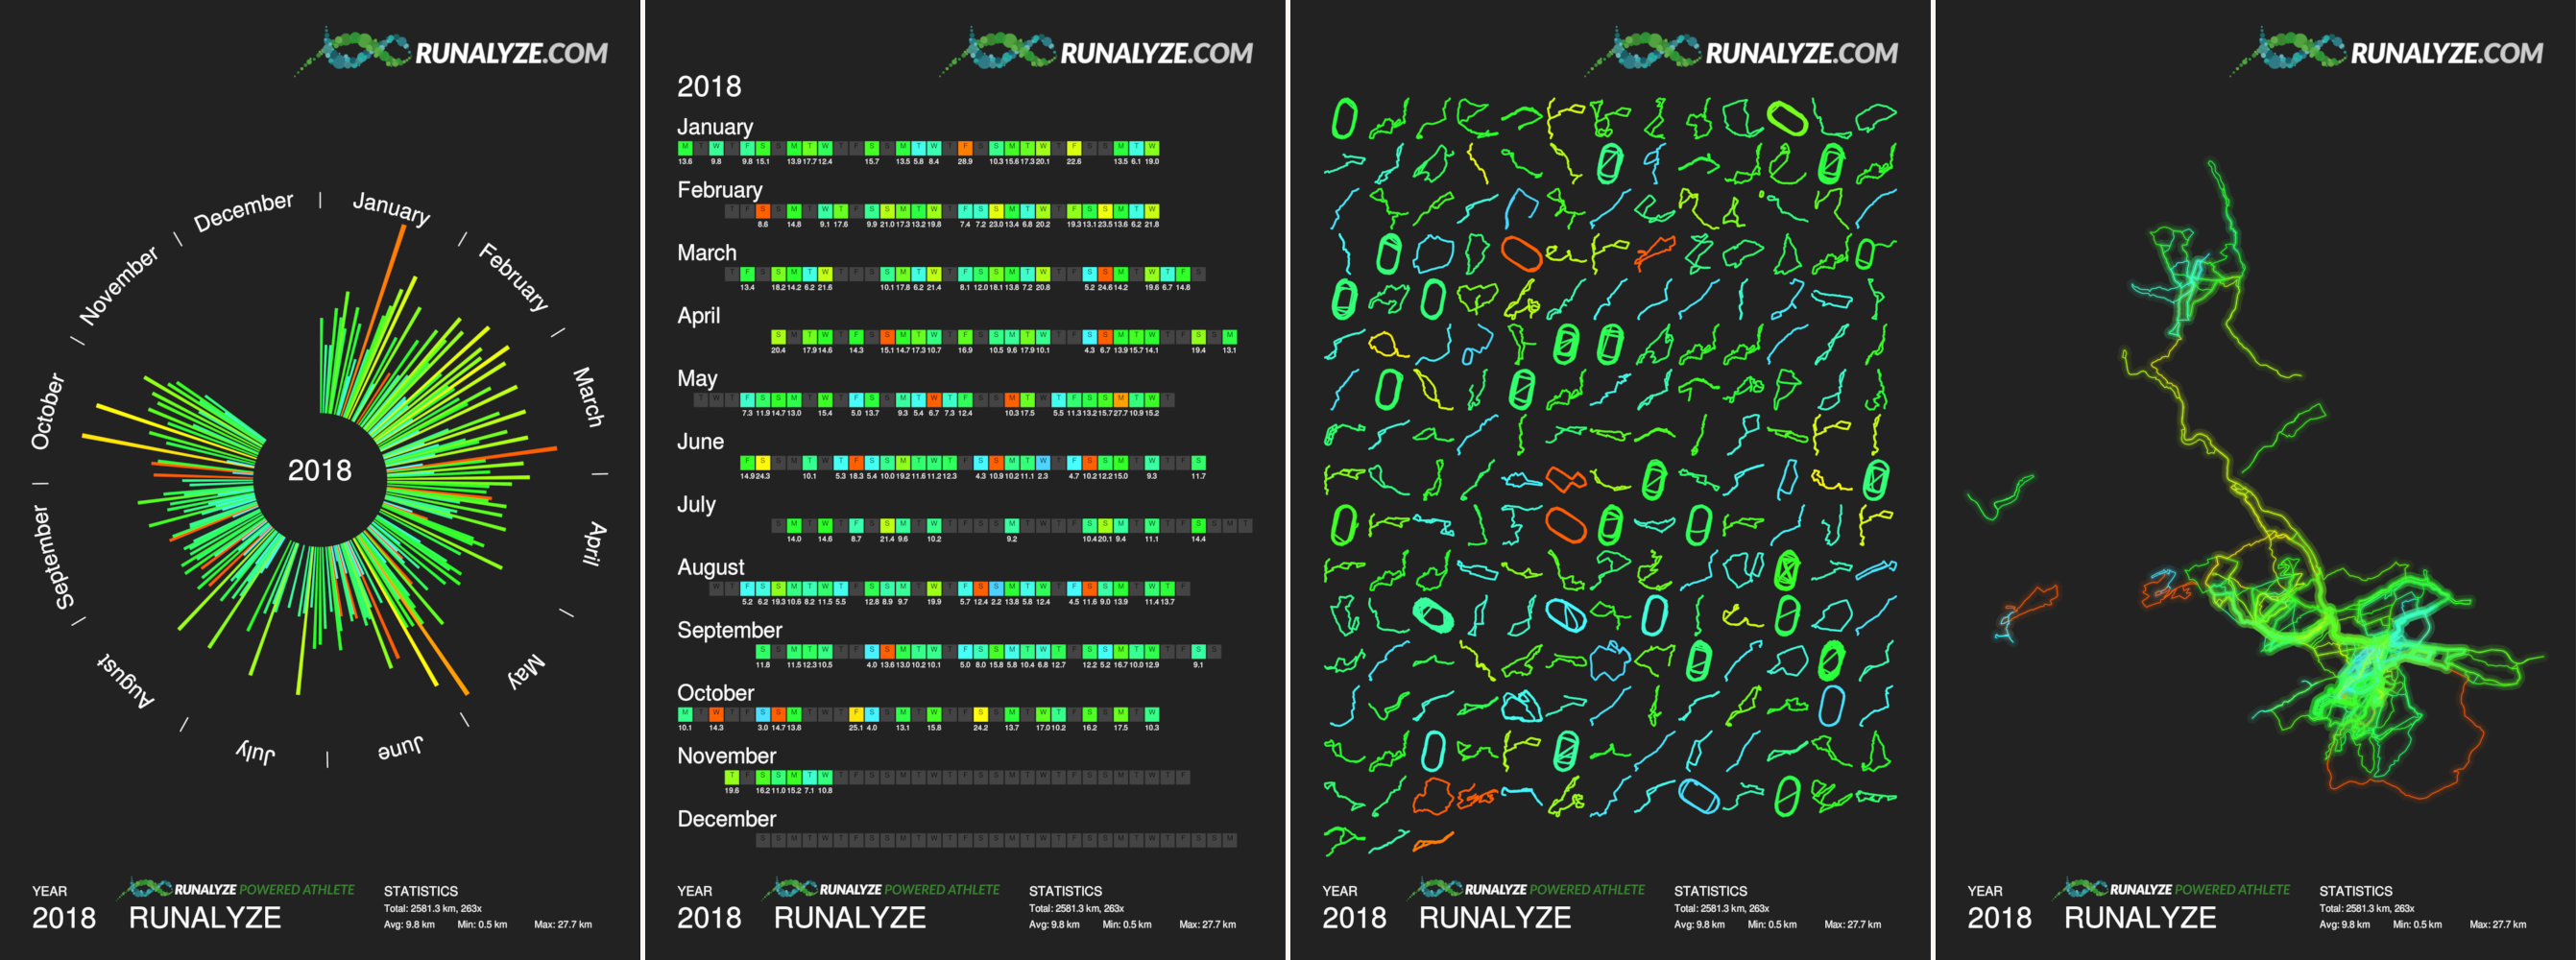
Gradient coloring for all four poster types