New feature: Climb Score
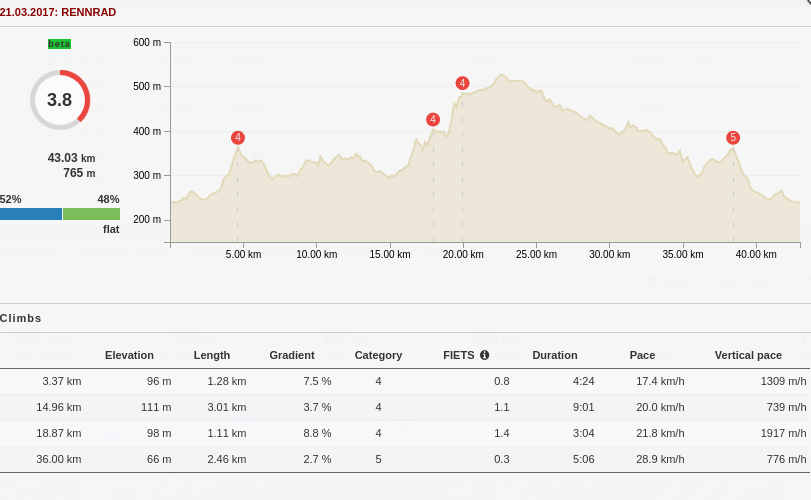
Climbing a mountain in running shoes or on the bike is always something special – not just since riders at the Tour de France show us how to conquer the toughest mountains. From now on, RUNALYZE will categorize all climbs in your activities and analyze them, from little hills of the 5th category up to mountains of ‘Hors catégorie’ (HC). The classification is based on the FIETS index, that uses length and gradient profile to calculate a single number for each climb.
In addition, all climbs – no matter whether they are classified or not – are used together with the elevation profile (How much of the course has been hilly?) to calculate an overall score for the activity, the so-called ‘Climb Score’. This score rates how challenging the course was as a single number between 0.0 (completely flat) and 10.0 (very demanding mountain stage).
Can you find the hardest climbs in your region and are you able to manage a course with a Climb Score of 10.0?
Note: This analysis depends on the quality of given elevation profiles. Noisy elevation data (e.g. gps data) can cause strange numbers.
If you want to discuss about this feature you are welcome to use our forum
New tool: Trend analysis
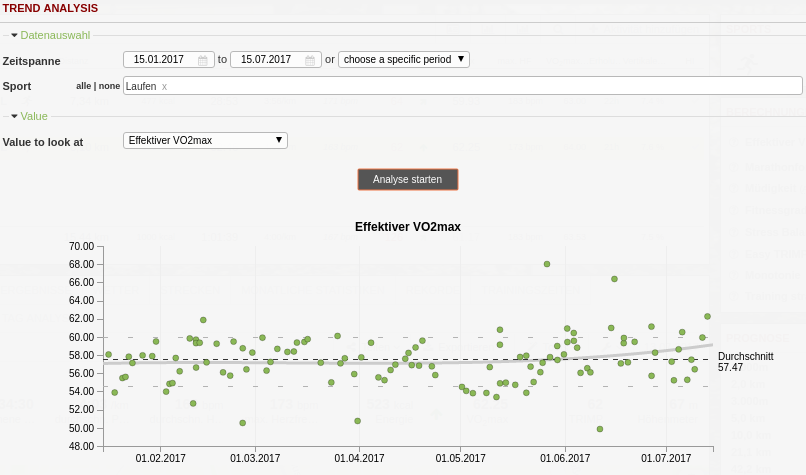
There’s a new tool to keep an eye on the long-term progress of your activity data. The trend analysis tool allows to plot single activity values (e.g. pace, distance, duration, running dynamics, …) for a given period to see how your values evolved. This way you can check the long-term trend of your metrics like cadence or pace.
In addition to the activity values, which are shown as points, median, 10%- and 90%-quantile and a polynomial trend line (fourth order) are shown.
Glossary
When you look at RUNALYZE you may see terms which are not self-explanatory. We have added a glossary with definitions of the most important terms. Still, this glossary is in progress. We are happy to hear some additions for existing terms or new definitions.
Others
We have added a lot of new activity analysis tools in our last version. From now on you can directly access them via the databrowser by adding the new tool tooltip to your dataset or by clicking on the values like VO2max and Climb Score.