One thing is often in the foreground for ambitious runners: the current form. In order to always know where you are and whether the training of the last few weeks has been effective, RUNALYZE displays the Effective VO2max, which serves as an indicator of your current performance. We now have a new view for you, which shows you the progress of your running form and compares the results achieved in running events with it.
You can find the definition of Effective VO2max in our glossary. How we estimate the value and how you can adjust the calculations can be read in our help section.
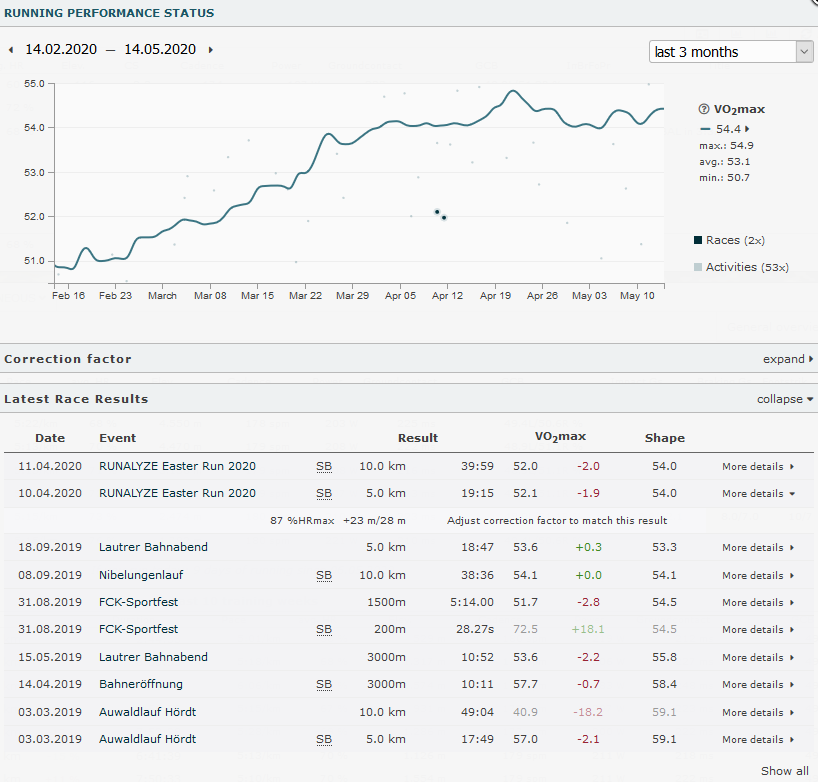
The ‘Running Performance Status’ graph shows the course of the effective VO2max for the selected period. It also shows the current trend, together with the values of the individual activities and – if available – competition results.
The athlete shown here has increased his VO2max by over three points in the last three months – but this happened mainly in February and March. The individual activities do not deviate very much from the form and there are no outliers. If this would be the case, the individual activities should be excluded from the form (Edit –> remove the tick at ‘VO2max for shape’).
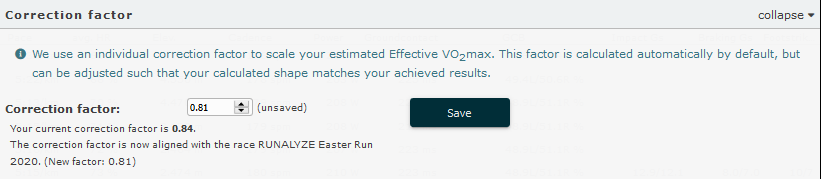
In order to ensure that the estimated shape matches the actual performance and to be able to display realistic forecasts, the correction factor must be set correctly. In this case, the athlete was not able to fully confirm his shape during the RUNALYZE Easter runs – although of course this was not a run under real competition conditions. It can therefore be assumed that the correction factor is correct. Otherwise, the factor can be adjusted directly by clicking on ‘Adjust correction factor to match this result’.
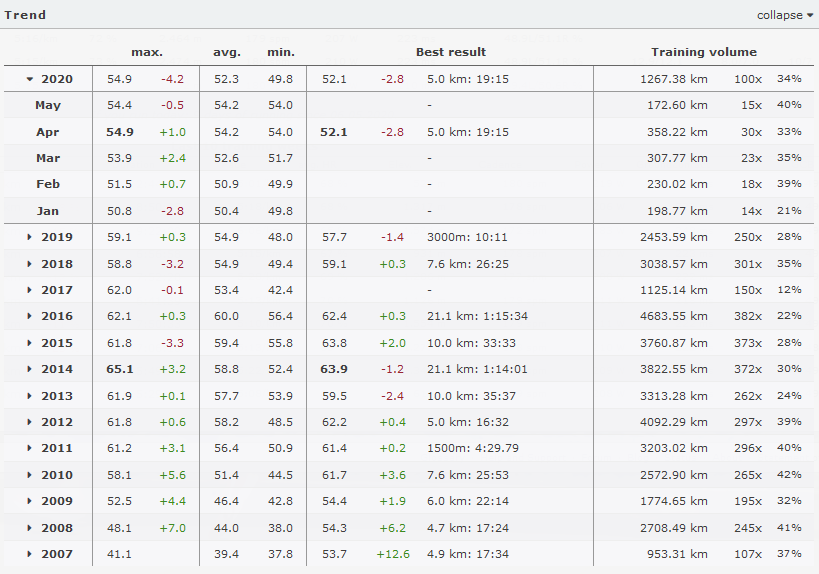
At the bottom there is a tabular listing of the Effective VO2max – by years and months – together with the best result and training volume (in distance, number of activities and proportion of quality sessions).
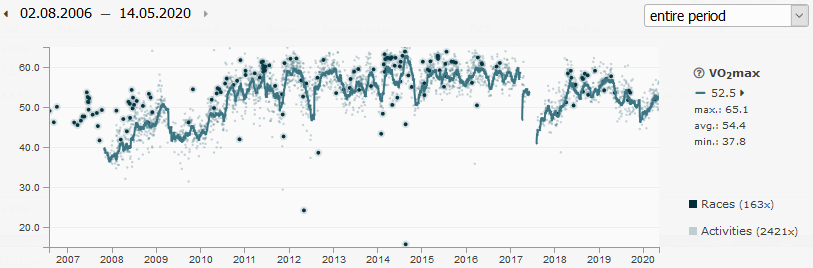
The athlete depicted had his form climax in 2014, but did not quite reach the calculated form at his half-marathon best time. The following year he confirmed the potential of the half-marathon time again with his 10k personal best, although the form did not quite allow it this time. Since his start of running in 2007, his VO2max has been climbing steadily until 2014, but since the injury break in 2017, the VO2max has not yet risen above 60 again.