Garmin beat us to it a few days ago, but this feature has also been on our wish list for a long time. Now it’s done and you can also colorize all your tracks by speed in Runalyze. So you can see directly on which sections you were especially fast or slow.
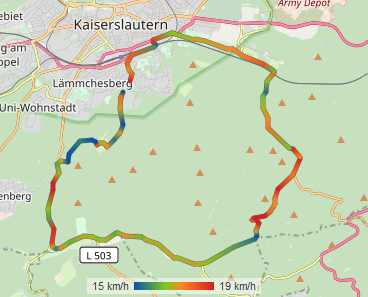
The color scale depends on your minimum and maximum speed (actually we look at the 5% and 95% quantile to ignore short outliers) within the respective activity.
To activate the color scale, you have to navigate to the speedometer on the right side of the map view and activate the box for pace that appears.
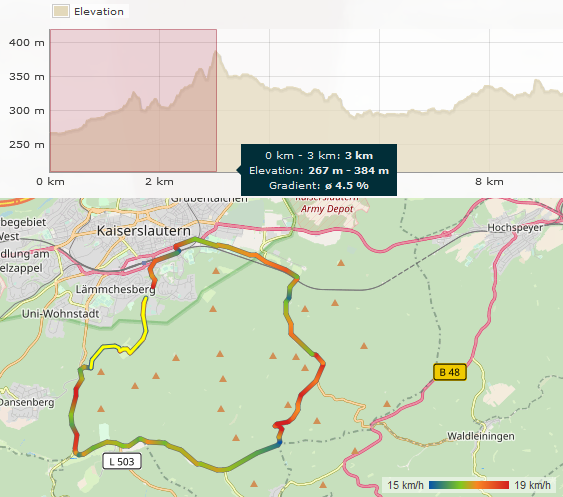
We also implemented another small improvement: If you select a section in one of the diagrams, it will be highlighted in the map view as well (provided the diagram uses the distance on the X-axis).
Limitations
Of course we know that some of you would like to have even more possibilities. So before your requests come: We are aware of the following restrictions, but cannot change them at this time.
- The coloring can only be done for pace. More options (heart rate, altitude, incline, …) will follow when the whole activity view is reworked.
- The color scale cannot be customized.
- The coloring cannot be activated by default.
- Minimum and maximum of the scale are currently always displayed in km/h or mph, even if the sport uses a different unit (e.g. min/km).