For ambitious runners, the main focus is on results. New best times want to be run and above all, for example, the 10 km best time is to be run afterwards on the half-marathon track. But is the person in a position to do this at all, or is there a lack of basic speed or stamina to achieve the best time on another track? How can results from different distances be compared with each other?
Thanks to the Effective VO2max, RUNALYZE already offers a comparison value for different distances. Results of the competition can also be compared by age grade. These values were already available, but now provide a particularly simple view of the performance and possible strengths and weaknesses of an athlete in the new performance chart.
The Performance Chart provides an overview of all the results of the competition (only running) over the different distances in three different views, scaled according to age standard, Effective VO2max or Pace.
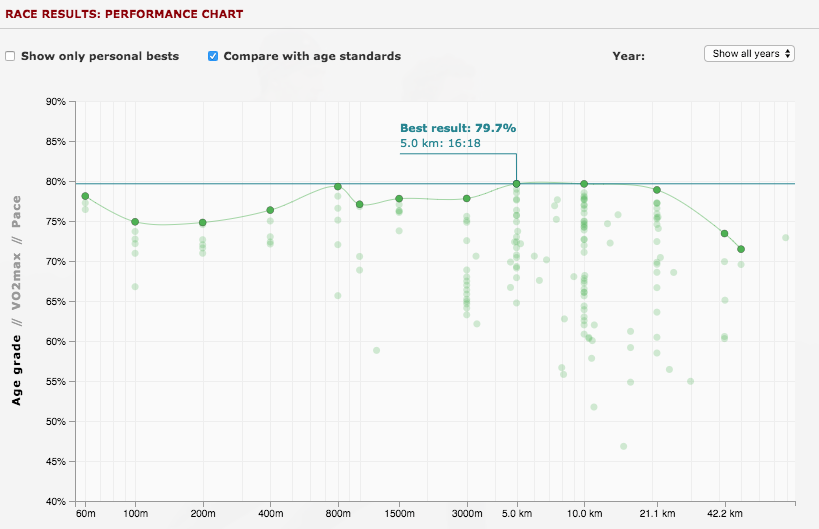
In this example, the results are presented by age standard and the best result is highlighted. In this case, 800m, 5 km and 10 km lead times are all on the same track. The other distances, however, are sometimes significantly reduced. Of course, a runner can hardly achieve the same performance over all distances. A good sprinter will hardly be able to run a particularly fast marathon – or vice versa. On the distances between 800m and 5 km there is obviously still potential in this case.
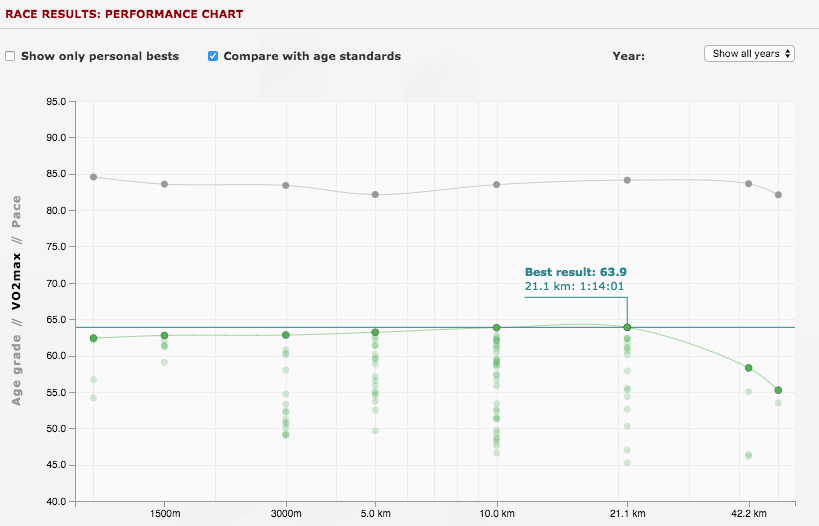
However, the age standard compares the results with the world record and world best times of the respective age group. This allows a comparison with the rest of the runners’ world. The Effective VO2max is more suitable for the transmission of equivalent power over different distances. These evaluations are only available for distances starting from 1,000m. In this case, 10 km and half marathon time are now on a line, which in this case corresponds to the runner’s strengths and abilities – in contrast to the presentation of the age standard. In the diagram you can now also display the age standards with the corresponding Effective VO2max values.
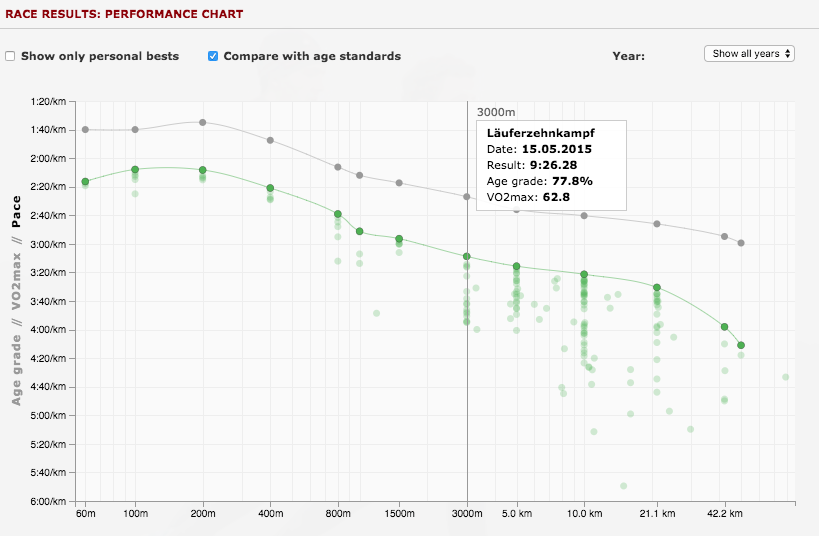
A third possibility is the representation according to Pace.
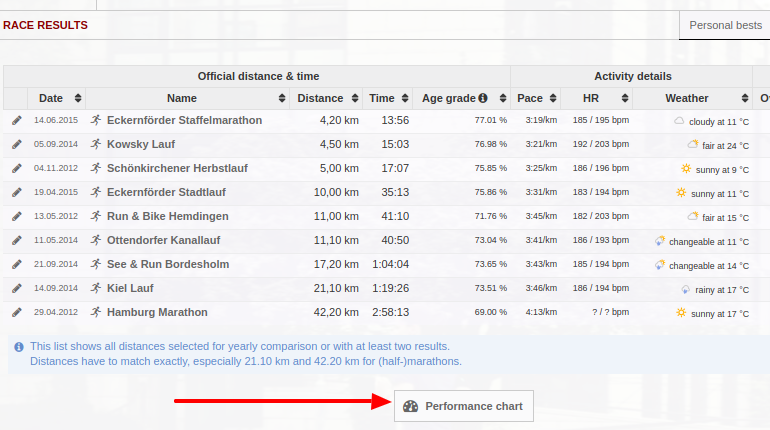
Where do I find the performance chart for races?
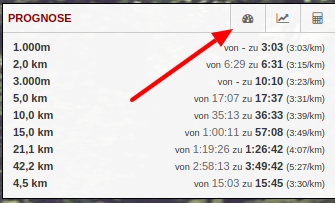
or