
Machine Learning: Runalyze can now guess your activity type
 -
-
The feature presented here is a beta feature that is only available for Supporter and Early Premium users. You can sign up for a supporter or premium subscription via your upgrade page. All the analysis that Runalyze offers you for your training data is usually based on the simple but important assumption that you record […]
Premium feature: Aerobic Decoupling view
Aerobic Decoupling (also known as Cardiac Decoupling) is a measure for how much your heart rate drifts (known as cardiac drift) over time. To calculate the value, the ratio of power or pace to heart rate of the first and second half of the activity is compared. For Premium users, this calculation is now available […]
Analysis tool: Quality sessions
 -
-
This presented feature is a premium feature that is only available for Runalyze Early Premium subscribers. You can try the premium offer for free for 7 days or upgrade directly via your upgrade page. In order to prepare optimally for the next competition, runners cannot avoid the necessary tempo training. Of course, training also includes […]
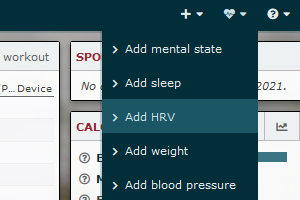
Runalyze now supports daily HRV readings
 -
-
Being a successful athlete involves not only proper training, but also proper recovery. In particular, it depends on the coordination of the two: Intensive training sessions only achieve their desired effect when the body is ready for the stimulus. To be able to determine the readiness of the body, one can look at a wide […]
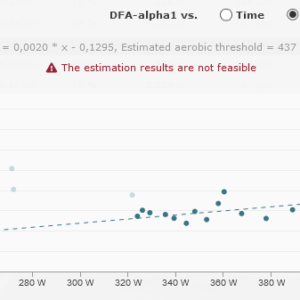
HRV: Improved estimation of DFA-alpha1 values
 -
-
Back in January, we presented our experimental feature for estimating aerobic threshold using HRV. Since this first implementation, we have worked considerably on the implementation of the method and can thus put to rest the original skepticism about how useful the determined values actually are. The basic principle: Using the exact RR intervals between the […]
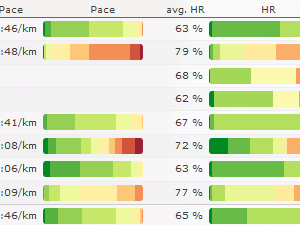
New: Color bars for intensity by zone distribution
 -
-
Runalyze has recently added a way to directly assess the intensity of an activity in the calendar view at a glance: The color bars for the zone distribution. These show you directly how large the share was in the respective zones.
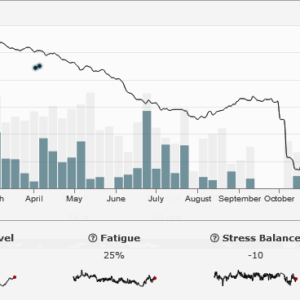
Aerobic threshold estimation based on HRV
 -
-
Runalyze has a new experimental feature: for activities with HRV data (or RR intervals) the aerobic threshold can be estimated (or at least it’s tried to do so). The idea for this comes from two recent publications by Gronwald [1] and Rogers [2] and a python workbook by Marco Altini. For this, the activity is […]
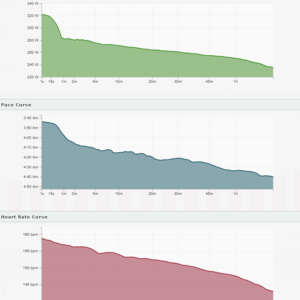
Performance curves for single activities
 -
-
With the latest update, Runalyze can now display power, pace and heart rate performance graphs for individual activities. These graphs show the best or maximum performance for all possible time periods – from one second to the entire activity duration. This type of diagram should be familiar to cyclists in particular, who know this diagram […]
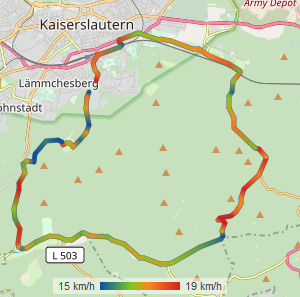
Color route according to speed
 -
-
Garmin beat us to it a few days ago, but this feature has also been on our wish list for a long time. Now it’s done and you can also colorize all your tracks by speed in Runalyze. So you can see directly on which sections you were especially fast or slow. The color scale […]
How to setup your account
 -
-
Runalyze wants to accompany you in your daily training and help you to evaluate your training and make it as efficient as possible. Many of the calculations are tailored to you and your characteristics. In order for these calculations to give you the correct values for you personally, we need some personal details from you. […]
 Follow us