
Rate your training with Subjective Feeling
 -
-
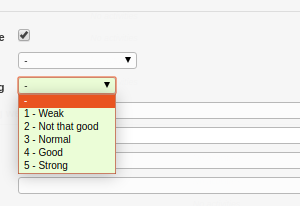
Besides the evaluation of the training with the RPE value (Rate of Perceived Exertion) there is now another possibility to evaluate the training: Subjective Feeling. What’s the difference? Let’s say you’re doing an interval session. On the RPE scale of 6-20 the training can be very hard (e.g. a value of 17), but you didn’t […]
RUNALYZE works with Fitbit now
 -
-
RUNALYZE now works with Fitbit. The automatic synchronization with Fitbit allows you to transfer your activities from Fitbit to Runalyze without any effort. For the beginning it is only possible to transfer activities from Fitbit. Once we have refactored the health area, other data will also be transferable. FAQ Can I sync my Fitbit history to […]
New: Dynamic histograms
 -
-
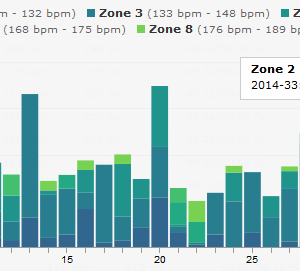
After a short beta test, our new histogram feature is now available for all users. This replaces in particular the old diagrams for the weekly and monthly kilometres. Meanwhile, the new histograms are much more powerful and can be dynamically adjusted. The tool also allows evaluation by tags (which day was used how often or […]
Import activities via mail
From now on you are able to import activities via mail. Why would you do that? Some apps can export activities to different file formats, but do not support direct export to Runalyze. You can use this feature to easily send your activities to Runalyze from those apps. What do I have to do? Activity […]
Zone configuration for everyone!
 -
-
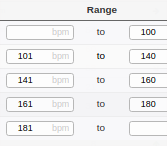
Do you remember the statement “You’ll be soon able to configure your own zones.“? “Soon” took a little longer in this case, but finally: Here it is! Which zones can I configure? You can now configure heart rate, pace and power zones for every sport. (For power, you still need to activate the power […]
External apps can push activities to RUNALYZE now
 -
-
The synchronization feature with Garmin, Polar, Suunto and TomTom is still in progress, but we can now offer third-party apps the possibility to send activities directly to RUNALYZE. We have implemented a limited API for this purpose. Step by step we will give more apps access to the interface after checking them beforehand (if you […]
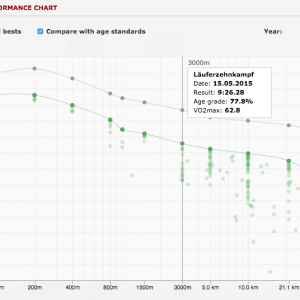
Performance chart for races
 -
-
For ambitious runners, the main focus is on results. New best times want to be run and above all, for example, the 10 km best time is to be run afterwards on the half-marathon track. But is the person in a position to do this at all, or is there a lack of basic speed […]
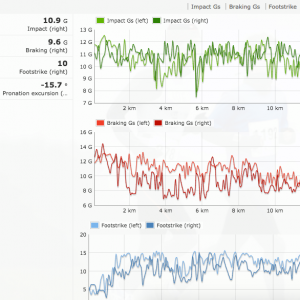
Support for RunScribe metrics
 -
-
More and more data can be recorded while running. Many new devices to try to learn more about the running style and the forces that actually occur. One promising project is RunScribe. With one RS+ Pod each on the left and right, four new metrics can be recorded in addition to the step frequency and […]
Analyze time series & show best sub segments
 -
-
Analyzing your data is one of the main objectives in RUNALYZE. Therefore we added a new tool to the activity view. Analyze time series So far, this tool offers some basic statistics for your complete time series, i.e. (arithmetic) mean, minimum, maximum, median (50% quantile), mode (most common value), coefficiant of variance (std / mean), […]
SmO2 & THb data support
 -
-
We are happy to announce that we now support SmO2 (muscle tissue oxygen saturation) and THb (Total Hemoglobin concentration) data from FIT-Files from up to two sensors. The plot for these values is available in the “Miscellaneous” section of your activity view. If you want to dig deeper into this topic, we recommend the Youtube Channel of Moxy. Since […]
 Follow us